1 Intro
Polyscope is used to visualize the data we got, which is what I also want to build one.
And this project is processed under instruction of Feichao Tian. Thanks a lot for his rich experience and patience.
2 Process
-
We get out geodesic process from this paper Geodesic Distance Computation via Virtual Source Propagation. It has O(N) linear time complexity. And what we appericate this paper is that, it’s not so heavy and his way to construct indices of mesh is unusual.
Because researchers won’t always consider the non-manifold solution. We want to fix this problem in his code. But unfortunately, some T situations happen.
And below is the picture which we map the geodesic data to a texture.
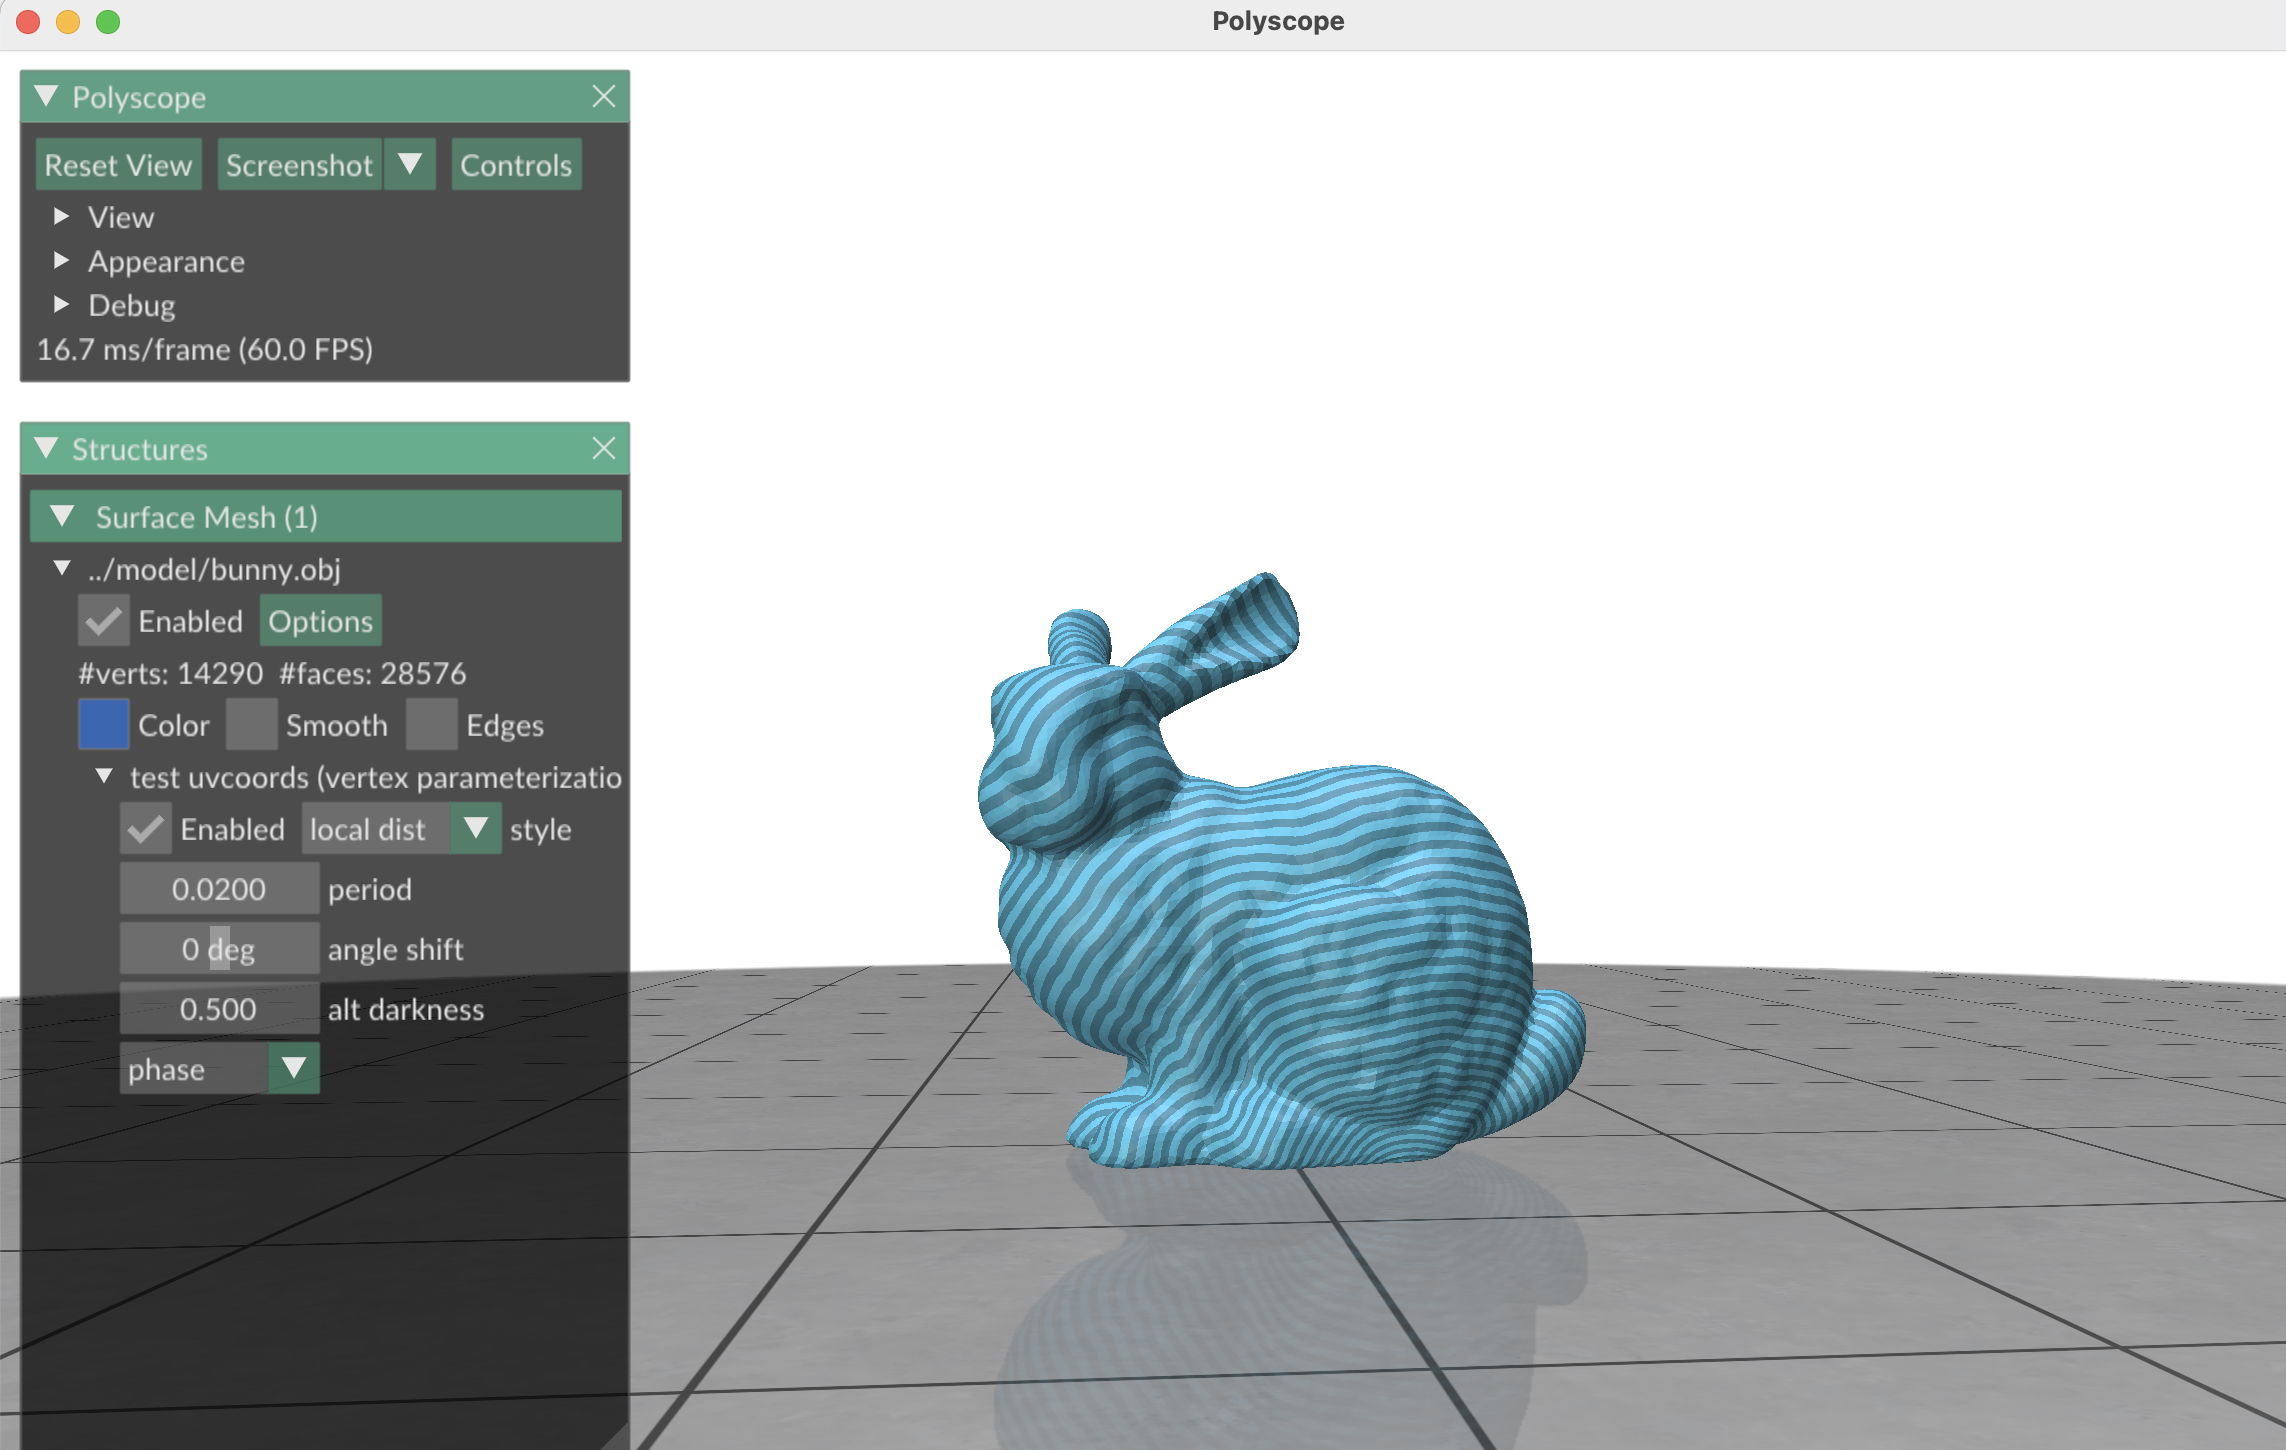
Fig. 1. countour result -
We want to plug nodes on geodesic lines. First we get geodesic lines, and then plug nodes with a constant delta on it. The delta is the plugging nodes’ distance away from each other. And we can got this. The first picture is the geodesic lines we got. Blue lines are contour texture, and the yellow lines are geodesic lines. And the second picture is the plugged points. While this time, geodesic lines is blue, and plugged point is yellow.
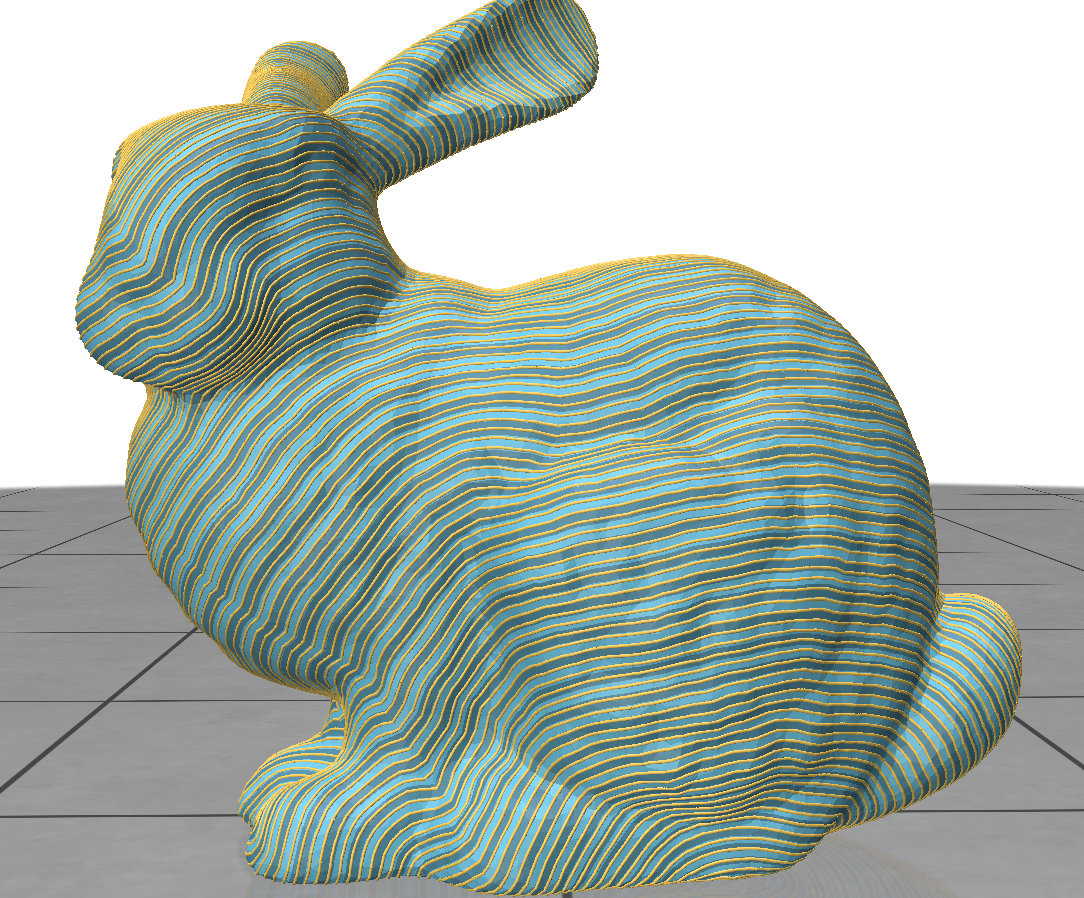
Fig. 2. geodesic line visualization 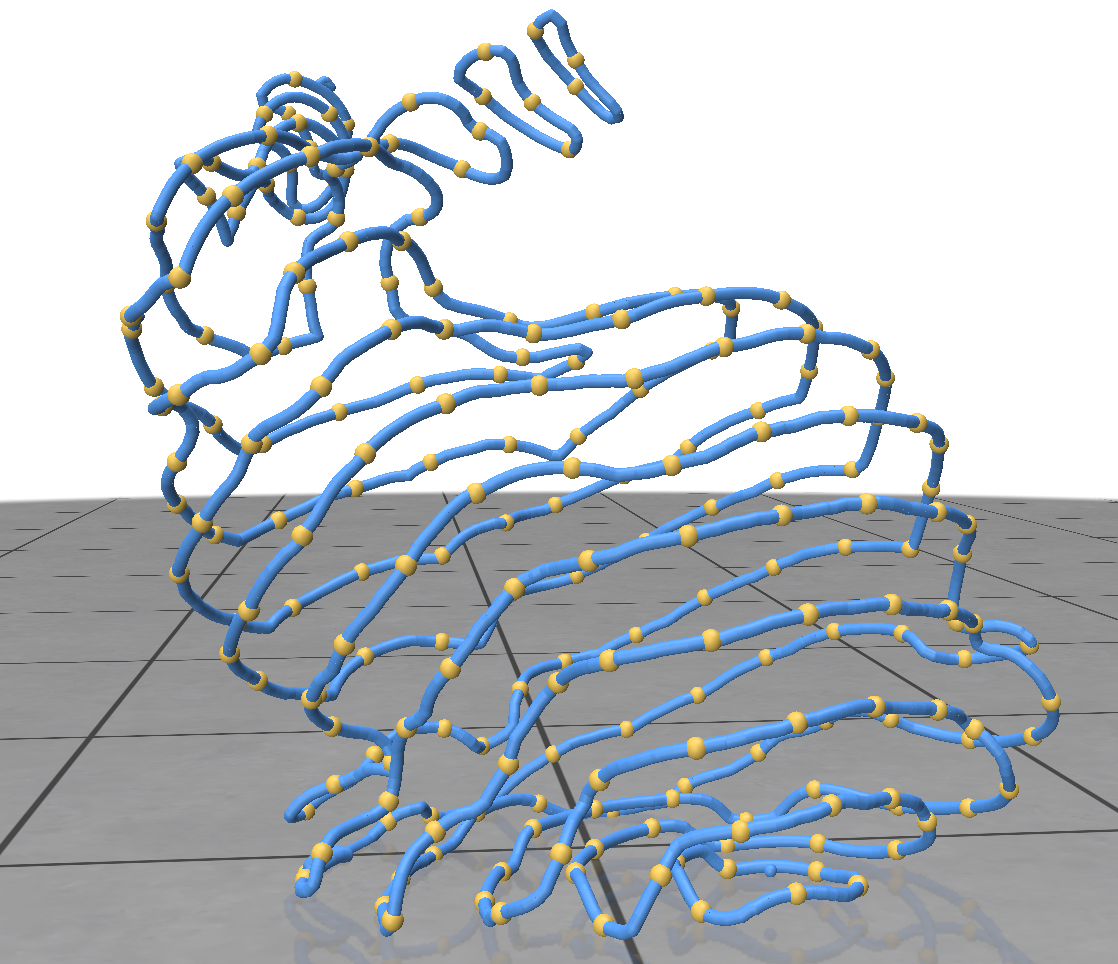
Fig. 3. inserted nodes visualization -
Third, we generate deluanay triangle from these plug nodes. We get those plug nodes and their faceID. And sort them by their faceid. After sorted, we deluanay triangulate the mesh triangle by triangle. Below is this step’s result.
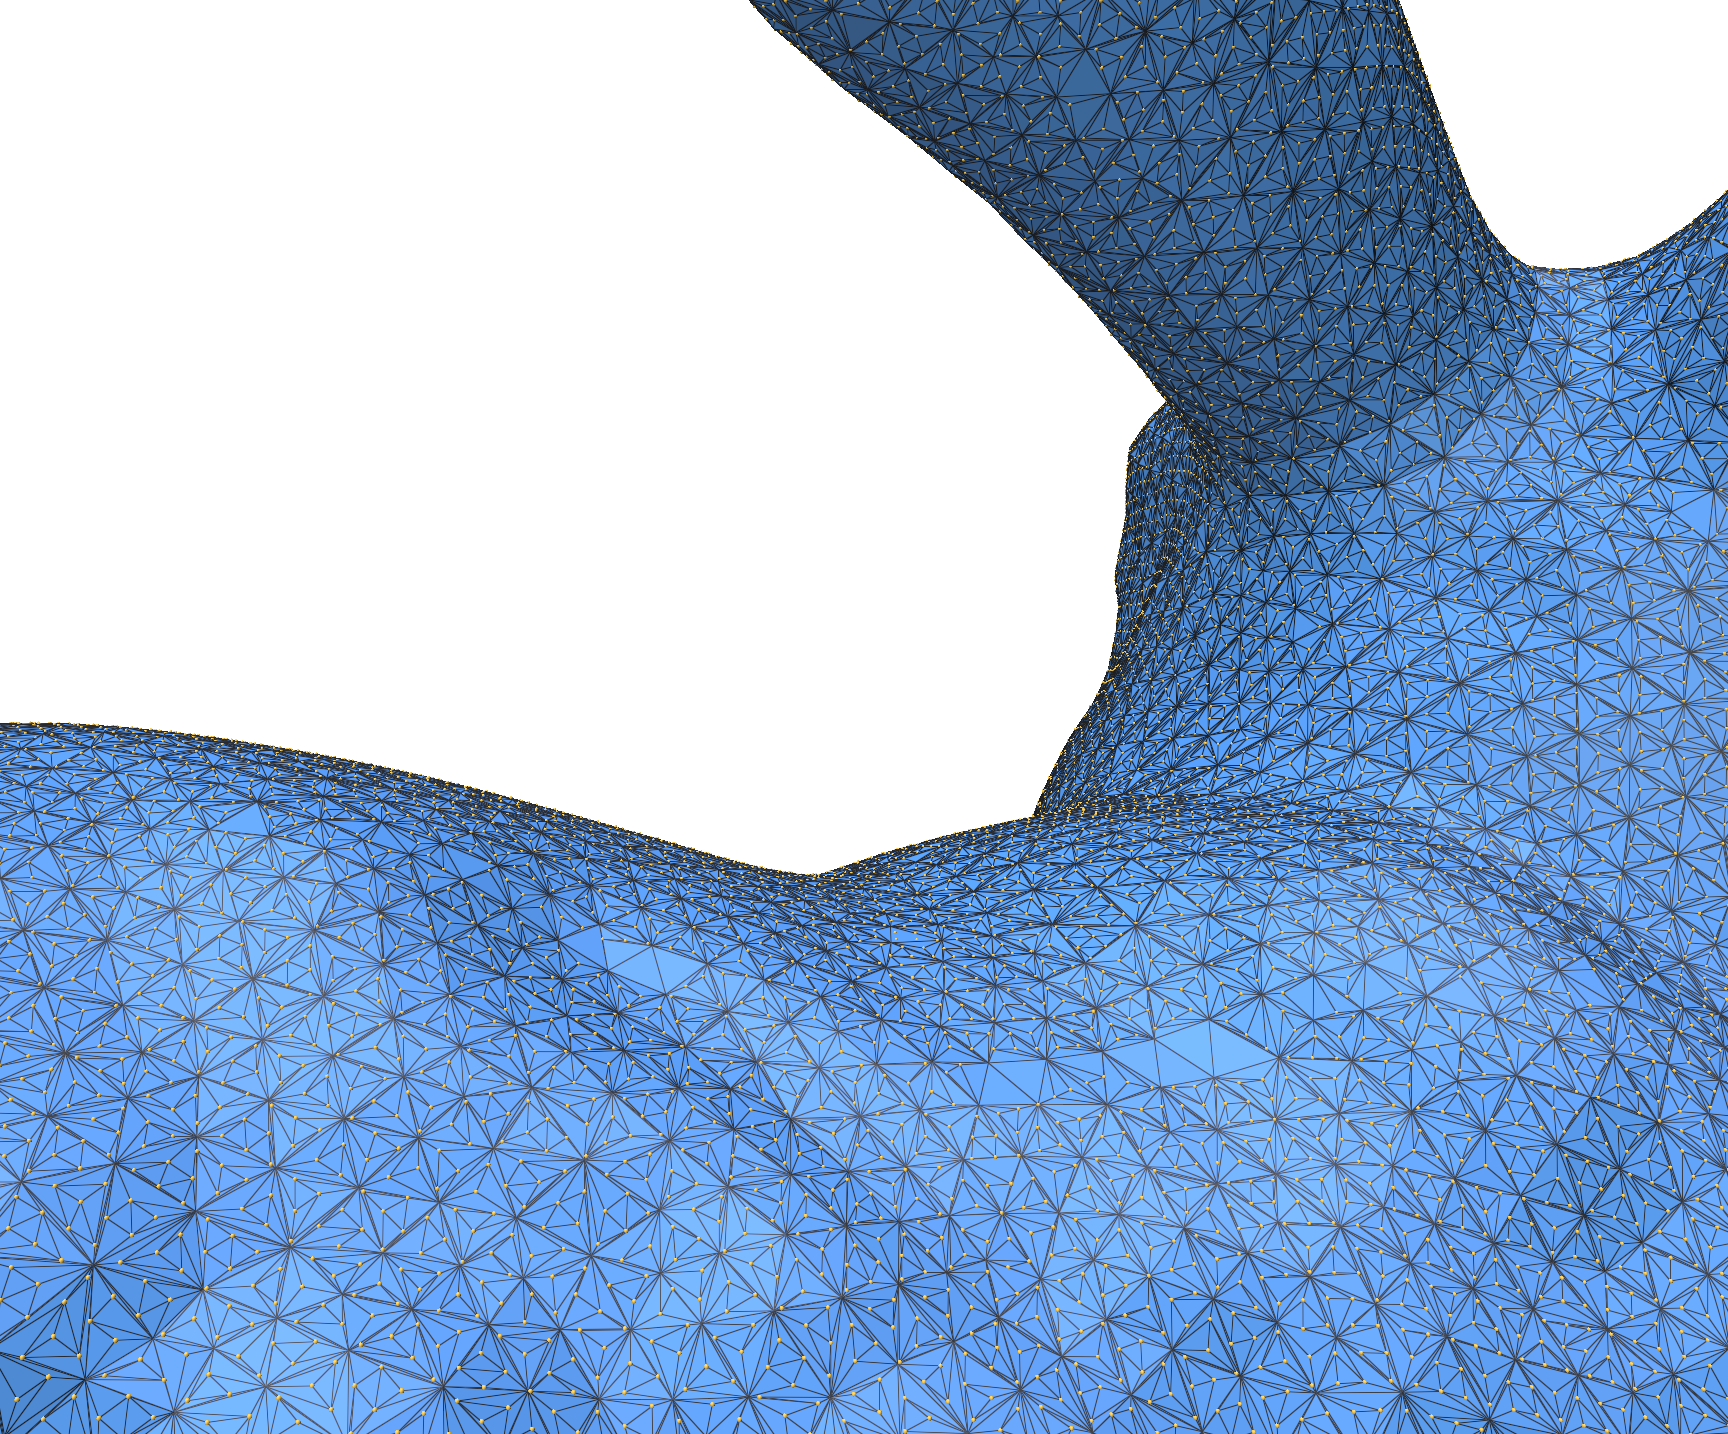
Fig. 4. deluanay triangulation -
Fourth, we need some flip operations and merge operations to do this. In this step, we use pmp-library as our tools. We use it to do flip and merge operations.
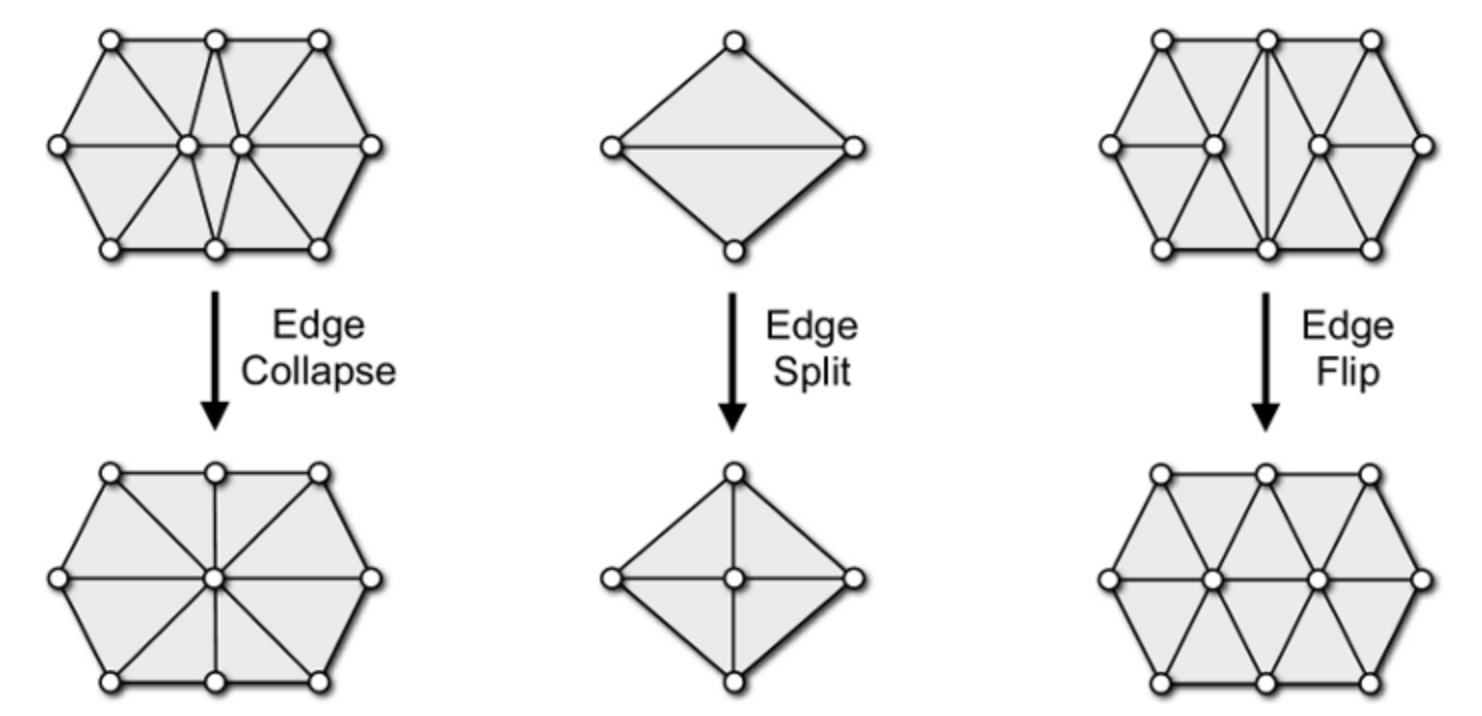
Fig. 5. flip & merge operations First we do clip until there is no edges to flip or only few edges to flip. Then we do merge, merge the origin input mesh’s vertex to the inserted nodes.
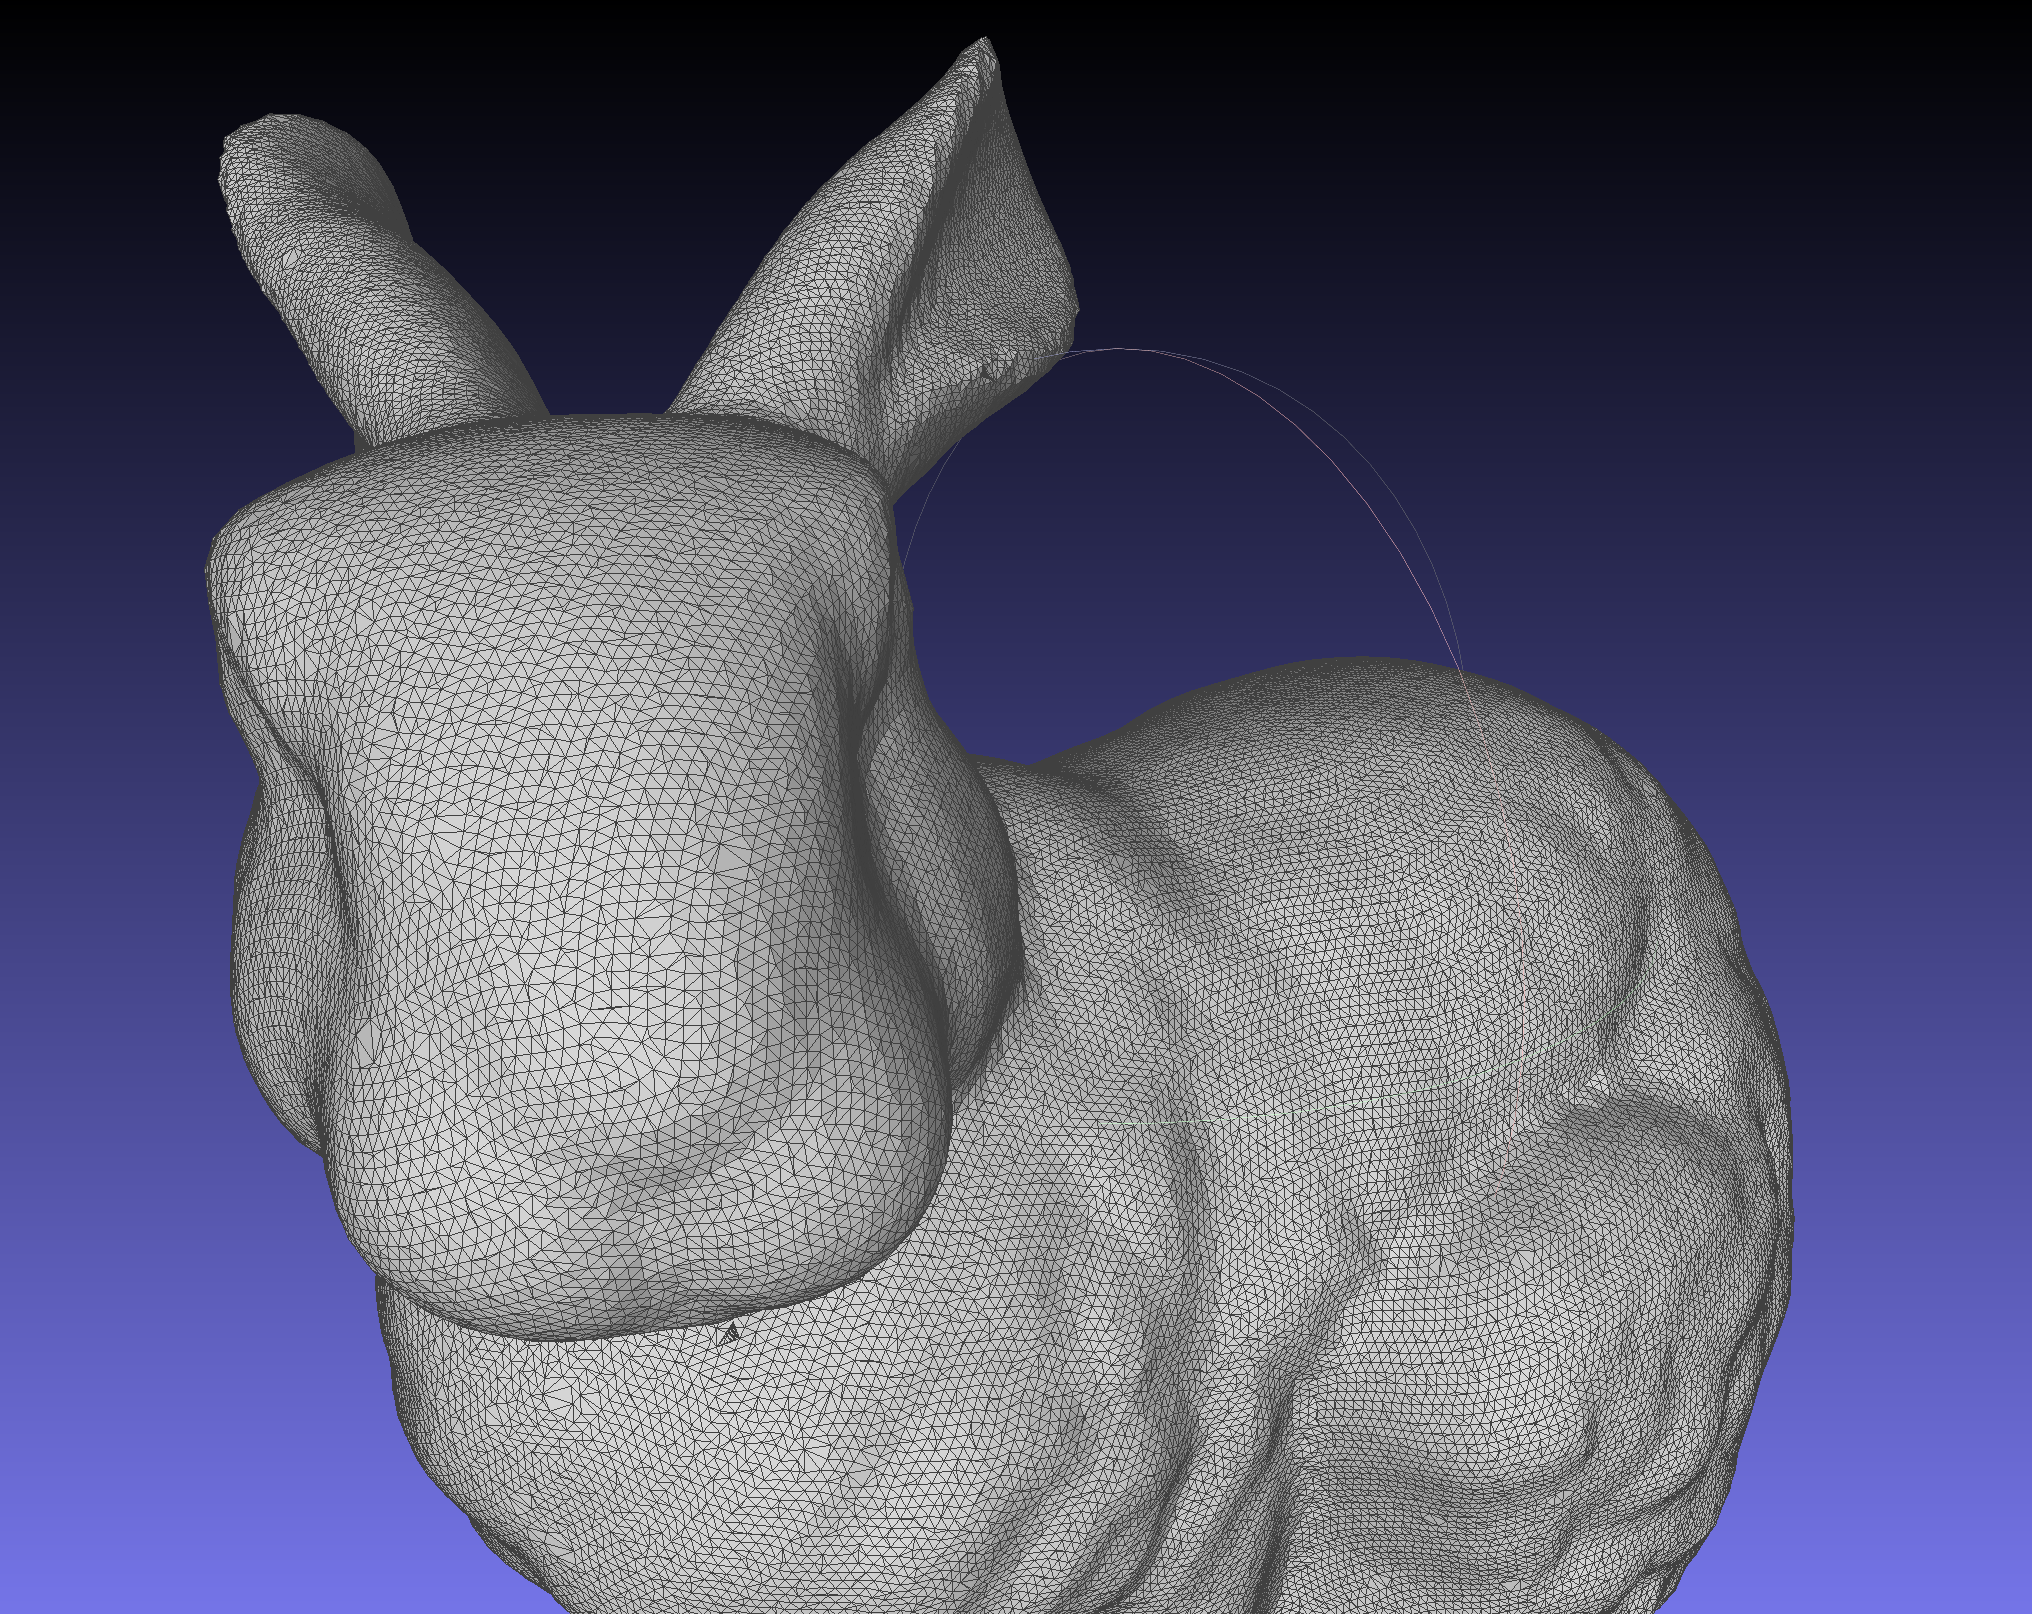
Fig. 6. Final result
3 Result
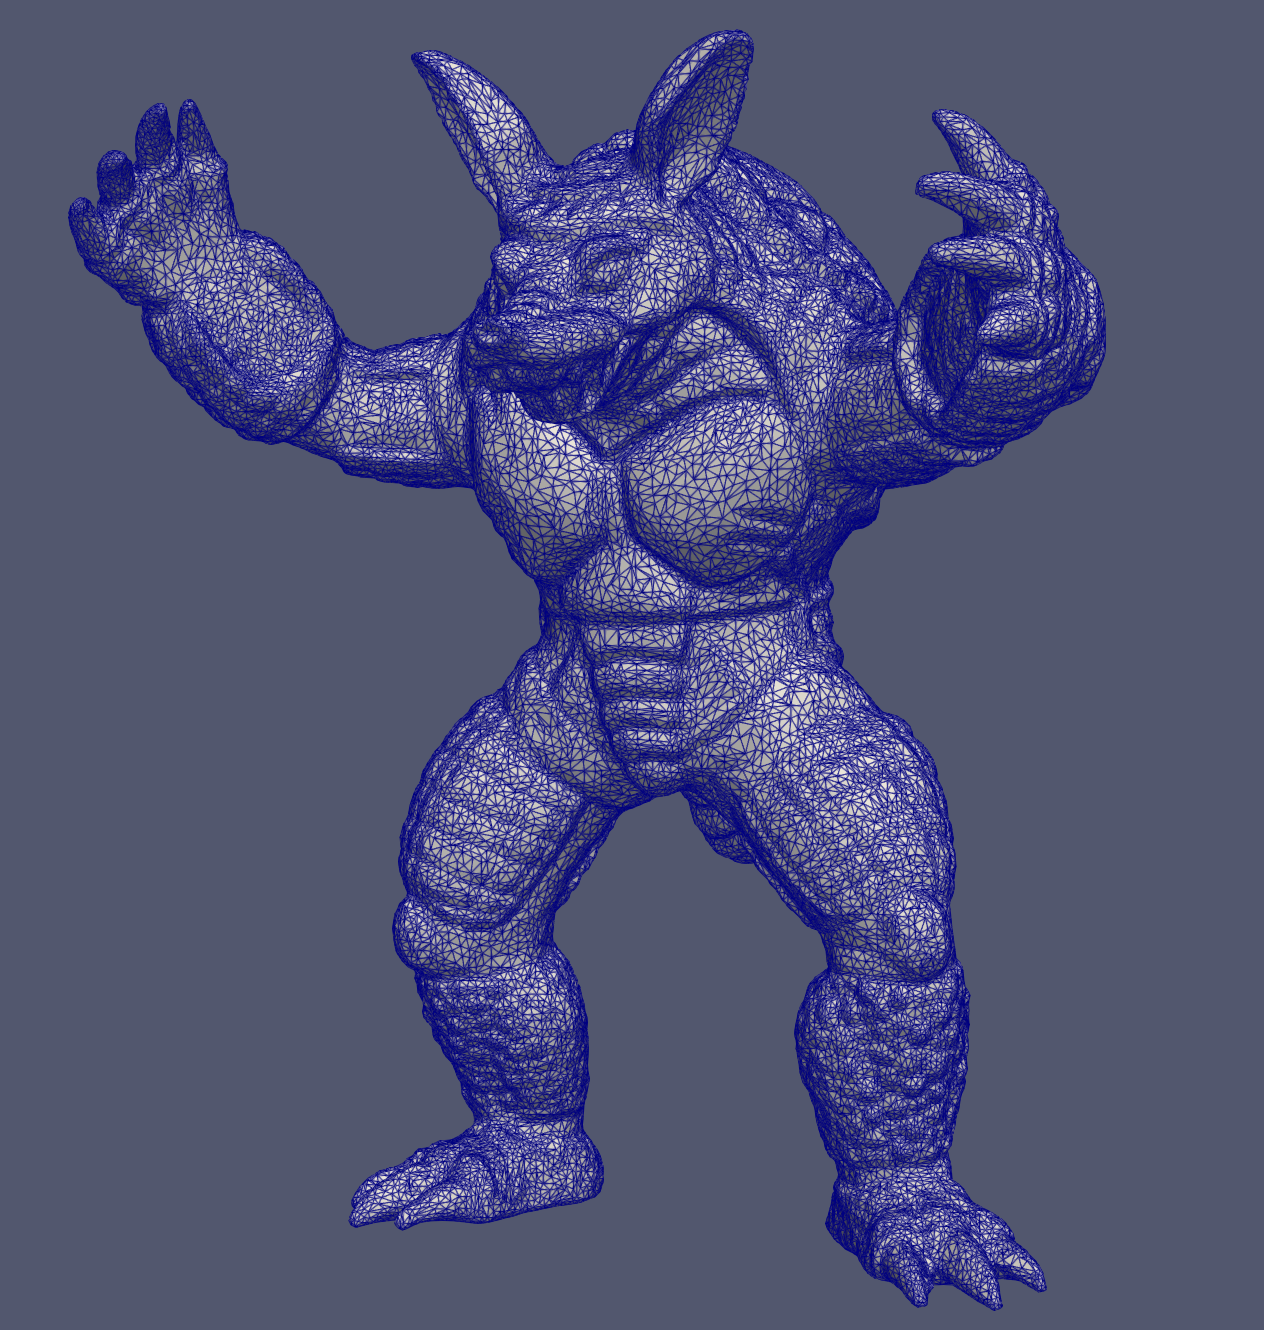
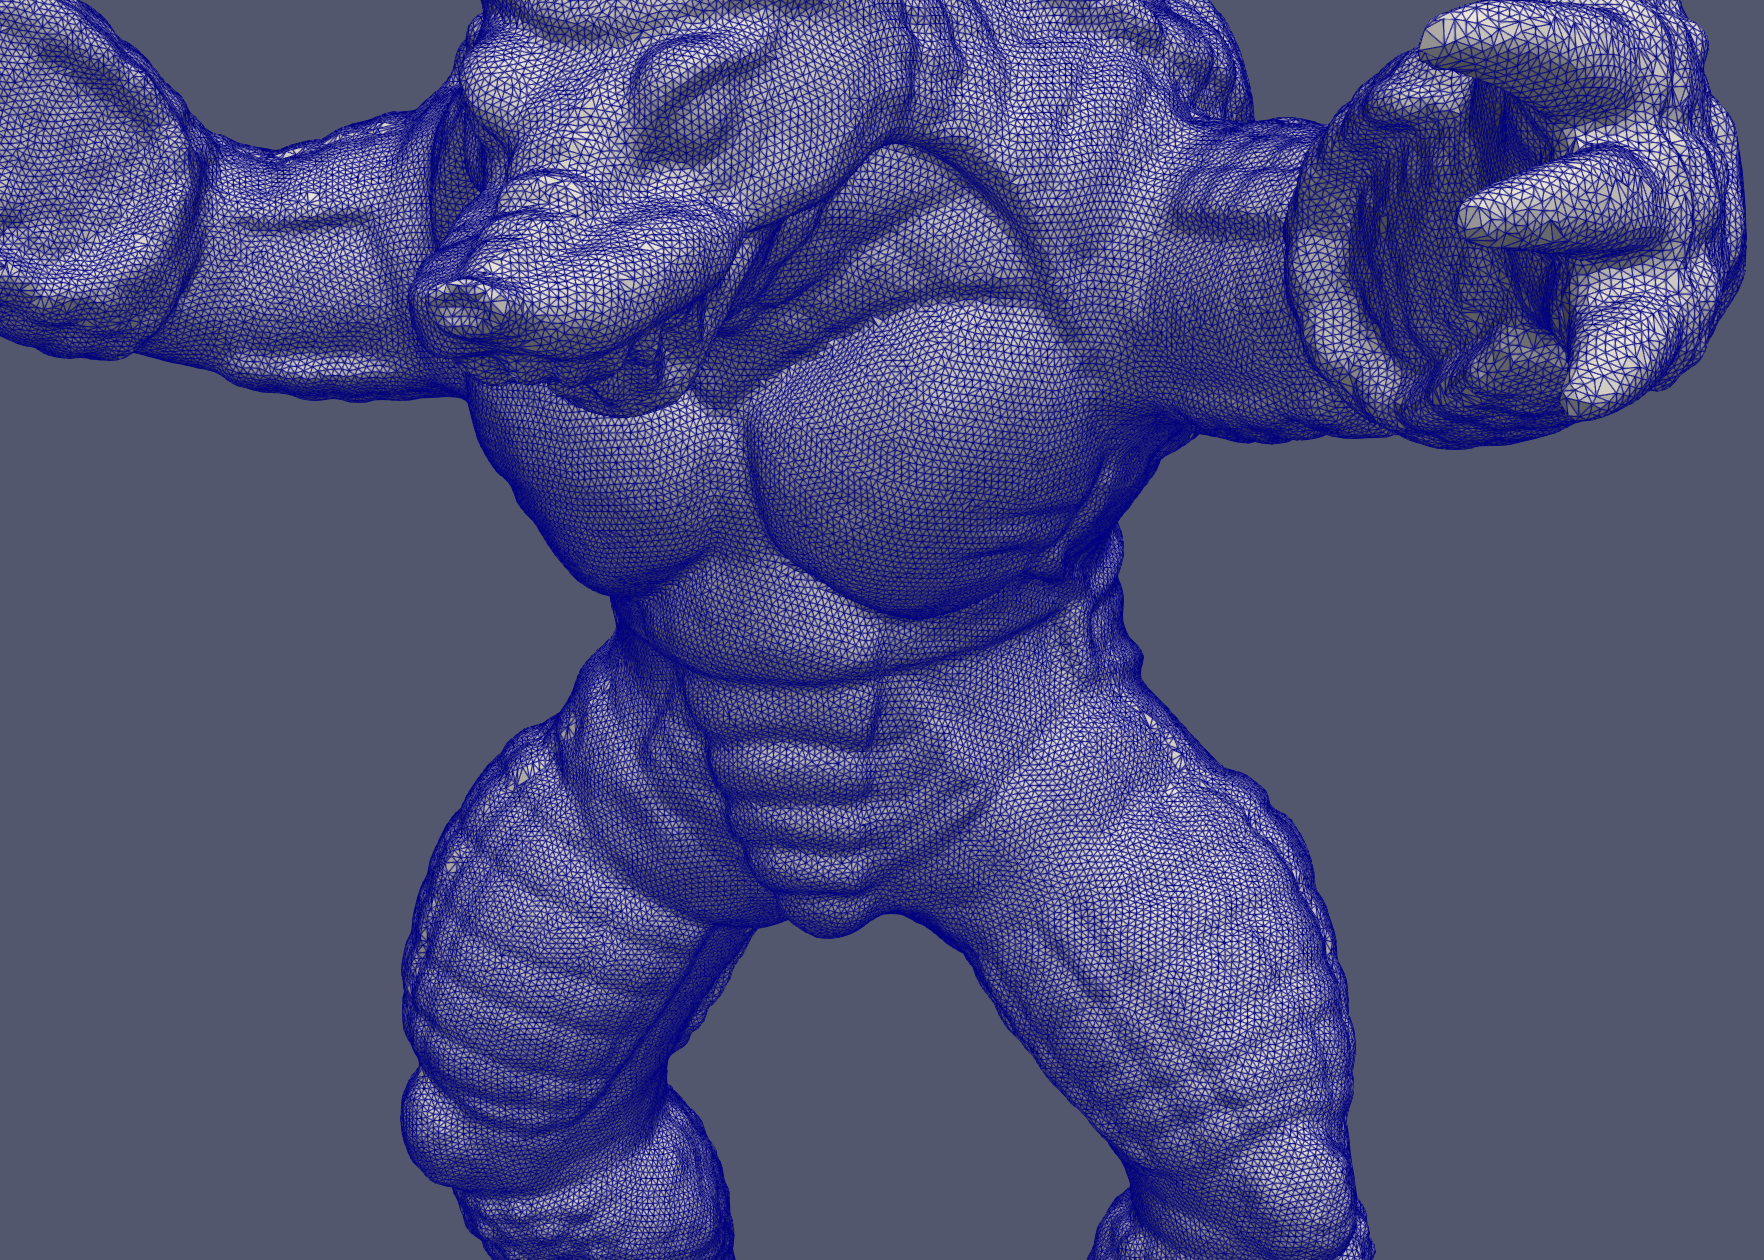
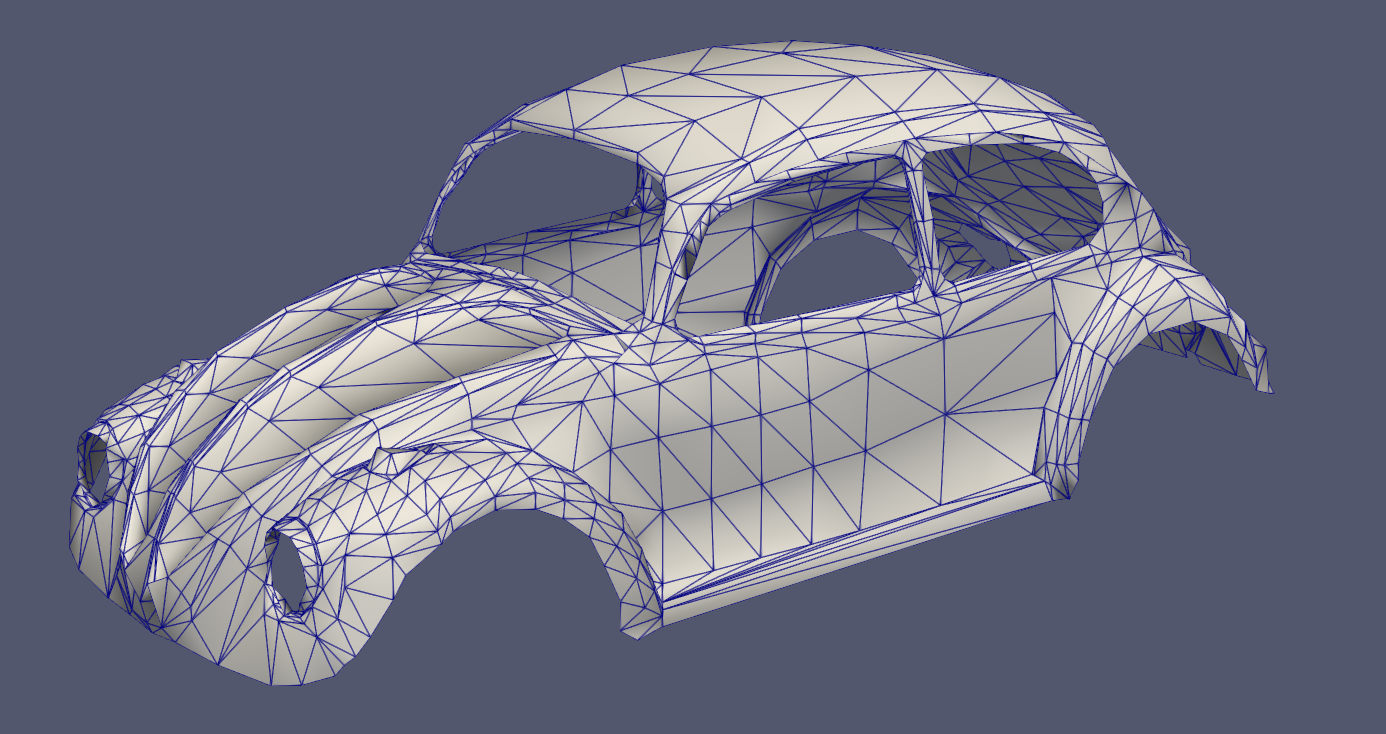
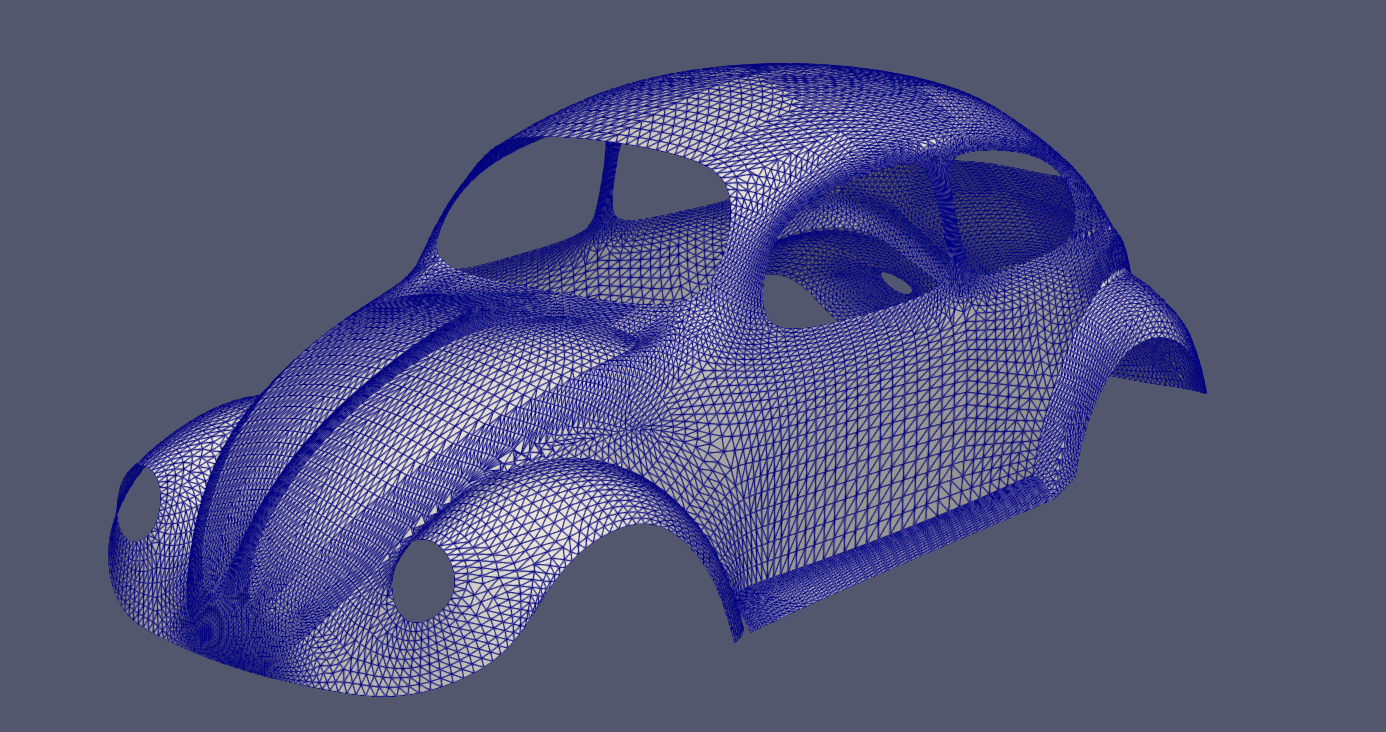
We’ve tested several models. And the program robusty is guaranteed.
Below are results for complicate models.
.